flowchart TD A["Raw Logs"]-->B["Context Builder"]-->C["Evidence"]-->D["LLM"]-->E["Reasoning"] A --> O["features.csv"] --> M["RF Forecasting"]
上次的後續
後來我斷斷續續又做了 3 次的實驗,每次實驗的手法都不同,唯一的共同點是我希望能夠驗證:LLM 可以做為 機器學習 (ML) 預測失準時的第二道防線。
資料來源設計差異
跟上一次的資料相比,這次的資料來源還是從 Faker 套件生成,不同的是為了符合現實情境,我改成不平衡資料,而且加入更多的攻擊跟正常流量的樣態,讓隨機森林模型容易預測出 FN 。此外後期為了實驗設置的需要,我把生成資料改成正確標記 label,實驗的結果也以觀察 FN 的資料是否改善為中心。
實驗 A: 不做任何前處理,直接比較不同情形下的給訊息策略
這個實驗是基於上一次的 Poc 流程設計,比較哪一種策略最好,因此還沒調整故意標錯 lebel 的設定。分成以下:
由 ML 預測(based line)
由 LLM 預測
由 ML 先檢測,預測為 0 (正常)的資料交由 LLM 再驗證
由 ML 先檢測,預測為 1 (異常)的資料交由 LLM 再驗證
由 ML 先檢測,全部的資料交由 LLM 再驗證
- 註:ML 在這裡一樣是隨機森林模型。
LLM 下達 Prompt
f"""
You are an expert in network intrusion detection.

Your task is to classify network traffic as:

0 = normal
1 = abnormal

This is a high-risk classification task.
Missing an abnormal attack is more costly than generating a false positive.
Pay particular attention to features indicating malicious activity.

Traffic Features:

Minute:
{row['minute']}

Requests per minute:
{row['requests_per_min']}

Unique IPs:
{row['unique_ips']}

IP density index:
{row['ip_density_index']}

Average response time:
{row['avg_response_time']}

Maximum response time:
{row['max_response_time']}

95th percentile response time:
{row['p95_response_time']}

4xx ratio:
{row['4xx_ratio']}

5xx ratio:
{row['5xx_ratio']}

Login failure rate:
{row['login_fail_rate']}

Bot attack User-Agent ratio:
{row['bot_attack_ua_ratio']}

Raw logs:
{row['raw_logs']}

Output exactly one digit:

0

or

1
"""
實驗結果重點
第 1 組在 1241 筆資料中有 92 筆資料為 FN, 7 筆為 FP
第 2 組(LLM only)沒有抓出這 92 筆FN,準確度看似比第 1 組高,但實際上只是有幾組沒有正面回答背強制判定為正常流量(0)
第 3 組(ML+ 正常資料給LLM)不僅沒抓出來FN,準確度還下降
第 4 組(ML + 異常資料給LLM)結果跟第 2 組一模一樣,沒有抓出這 92 筆FN
第 5 組(ML + 全給LLM)結果也跟第 2 組一模一樣,沒有抓出這 92 筆FN
只能能說太悽慘了QQ
完整實驗數據 Output
第 1 組
Accuracy : 0.9202256244963739
Precision: 0.0
Recall   : 0.0
F1 Score : 0.0

Confusion Matrix
[[1142    7]
 [  92    0]]

Classification Report
              precision    recall  f1-score   support

           0       0.93      0.99      0.96      1149
           1       0.00      0.00      0.00        92

    accuracy                           0.92      1241
   macro avg       0.46      0.50      0.48      1241
weighted avg       0.86      0.92      0.89      1241
第 2 組(LLM only)
===== LLM Prediction Result =====
Accuracy : 0.9258662369057212
Precision: 0.0
Recall   : 0.0
F1 Score : 0.0

Confusion Matrix
[[1149    0]
 [  92    0]]

Classification Report
              precision    recall  f1-score   support

           0       0.93      1.00      0.96      1149
           1       0.00      0.00      0.00        92

    accuracy                           0.93      1241
   macro avg       0.46      0.50      0.48      1241
weighted avg       0.86      0.93      0.89      1241

/root/miniconda3/envs/workenv/lib/python3.11/site-packages/sklearn/metrics/_classification.py:1565: UndefinedMetricWarning: Precision is ill-defined and being set to 0.0 due to no predicted samples. Use `zero_division` parameter to control this behavior.
  _warn_prf(average, modifier, f"{metric.capitalize()} is", len(result))
/root/miniconda3/envs/workenv/lib/python3.11/site-packages/sklearn/metrics/_classification.py:1565: UndefinedMetricWarning: Precision is ill-defined and being set to 0.0 in labels with no predicted samples. Use `zero_division` parameter to control this behavior.
  _warn_prf(average, modifier, f"{metric.capitalize()} is", len(result))
/root/miniconda3/envs/workenv/lib/python3.11/site-packages/sklearn/metrics/_classification.py:1565: UndefinedMetricWarning: Precision is ill-defined and being set to 0.0 in labels with no predicted samples. Use `zero_division` parameter to control this behavior.
  _warn_prf(average, modifier, f"{metric.capitalize()} is", len(result))
/root/miniconda3/envs/workenv/lib/python3.11/site-packages/sklearn/metrics/_classification.py:1565: UndefinedMetricWarning: Precision is ill-defined and being set to 0.0 in labels with no predicted samples. Use `zero_division` parameter to control this behavior.
  _warn_prf(average, modifier, f"{metric.capitalize()} is", len(result))
第 3 組(ML+ 正常資料給LLM再驗證)
Accuracy: 0.9186140209508461
Precision: 0.0
Recall   : 0.0
F1 Score : 0.0

Confusion Matrix
[[1140    9]
 [  92    0]]

Classification Report
              precision    recall  f1-score   support

           0       0.93      0.99      0.96      1149
           1       0.00      0.00      0.00        92

    accuracy                           0.92      1241
   macro avg       0.46      0.50      0.48      1241
weighted avg       0.86      0.92      0.89      1241
第 4 組(ML + 異常資料給LLM)
Accuracy: 0.9258662369057212
Precision: 0.0
Recall   : 0.0
F1 Score : 0.0

Confusion Matrix
[[1149    0]
 [  92    0]]

Classification Report
              precision    recall  f1-score   support

           0       0.93      1.00      0.96      1149
           1       0.00      0.00      0.00        92

    accuracy                           0.93      1241
   macro avg       0.46      0.50      0.48      1241
weighted avg       0.86      0.93      0.89      1241

/root/miniconda3/envs/workenv/lib/python3.11/site-packages/sklearn/metrics/_classification.py:1565: UndefinedMetricWarning: Precision is ill-defined and being set to 0.0 in labels with no predicted samples. Use `zero_division` parameter to control this behavior.
  _warn_prf(average, modifier, f"{metric.capitalize()} is", len(result))
/root/miniconda3/envs/workenv/lib/python3.11/site-packages/sklearn/metrics/_classification.py:1565: UndefinedMetricWarning: Precision is ill-defined and being set to 0.0 in labels with no predicted samples. Use `zero_division` parameter to control this behavior.
  _warn_prf(average, modifier, f"{metric.capitalize()} is", len(result))
/root/miniconda3/envs/workenv/lib/python3.11/site-packages/sklearn/metrics/_classification.py:1565: UndefinedMetricWarning: Precision is ill-defined and being set to 0.0 in labels with no predicted samples. Use `zero_division` parameter to control this behavior.
  _warn_prf(average, modifier, f"{metric.capitalize()} is", len(result))
第 5 組(全給LLM再驗證)
Total samples: 1241
Send to LLM: 304
Use RF directly: 937
LLM Predict: 100%|██████████| 304/304 [04:28<00:00,  1.13it/s]
========== Result ==========
Accuracy: 0.9258662369057212
Precision: 0.0
Recall: 0.0
F1: 0.0

Confusion Matrix
[[1149    0]
 [  92    0]]

Classification Report
              precision    recall  f1-score   support

           0       0.93      1.00      0.96      1149
           1       0.00      0.00      0.00        92

    accuracy                           0.93      1241
   macro avg       0.46      0.50      0.48      1241
weighted avg       0.86      0.93      0.89      1241


========== Time ==========
RF time: 0.066s
LLM time: 268.241s
Total time: 268.307s

/root/miniconda3/envs/workenv/lib/python3.11/site-packages/sklearn/metrics/_classification.py:1565: UndefinedMetricWarning: Precision is ill-defined and being set to 0.0 in labels with no predicted samples. Use `zero_division` parameter to control this behavior.
  _warn_prf(average, modifier, f"{metric.capitalize()} is", len(result))
/root/miniconda3/envs/workenv/lib/python3.11/site-packages/sklearn/metrics/_classification.py:1565: UndefinedMetricWarning: Precision is ill-defined and being set to 0.0 in labels with no predicted samples. Use `zero_division` parameter to control this behavior.
  _warn_prf(average, modifier, f"{metric.capitalize()} is", len(result))
/root/miniconda3/envs/workenv/lib/python3.11/site-packages/sklearn/metrics/_classification.py:1565: UndefinedMetricWarning: Precision is ill-defined and being set to 0.0 in labels with no predicted samples. Use `zero_division` parameter to control this behavior.
  _warn_prf(average, modifier, f"{metric.capitalize()} is", len(result))
實驗 B: 嘗試用微調處理
一開始想說要提升 LLM 做為第二道防線的能力,用微調處理似乎會比較好,所以嘗試了幾次,以下是其中一個實驗結果,策略為
生成不平衡資料
資料增強
轉 json、分訓練即跟驗證集
4.. 使用 LLaMA Factory 進行微調(對象:llama 3.2:3b)
- 檢測效果、觀察 FN 資料是否預測變好
餵給 LLM 判斷的資料與給隨機森林的稍有不同,因為隨機森林只能從數值(例如流量,請求結果)判斷是否有流量異常,但是 LLM 可以綜合原始 log 判斷,因此餵給 LLM 的資料欄位除了原有的數值欄位以外,多了 row_logs 這個包含相關原始資料的欄位。因此整體欄位有 :minute、requests_per_min、unique_ips、ip_density_index、avg_response_time、max_response_time、p95_response_time、4xx_ratio、5xx_ratio、login_fail_rate、bot_attack_ua_ratio、raw_logs跟label。
因為關注在 LLM 微調後是否改善,所以先不考慮隨機森林預測後的結果。資料增強考慮了幾種方法後,決定用最簡單的方式,先挑出異常資料複製,再針對餵給隨機森林的數值指標做擾動,使數值部分稍有差異。
資料增強前
label
0    11718
1      683
資料增強後
label
0    11718
1     3515
Thinking
後來想想,這樣其實不太好。因為即使我的擾動並沒有改動太多,數值跟原始資料並沒有對上。
實驗結果重點
LLM 的 prompt 設定如下
LLM 的微調設定如下
LLM 微調參數設定(訓練階段)
cutoff_len: 512
dataset: security_train
dataset_dir: data
ddp_timeout: 180000000
do_train: true
finetuning_type: lora
flash_attn: auto
fp16: true
gradient_accumulation_steps: 2
include_num_input_tokens_seen: true
learning_rate: 2.0e-05
logging_steps: 5
lora_alpha: 8
lora_dropout: 0
lora_rank: 4
lora_target: all
lr_scheduler_type: cosine
max_grad_norm: 1.0
max_samples: 100000
model_name_or_path: meta-llama/Llama-3.2-3B
num_train_epochs: 1.0
optim: adamw_torch
output_dir: saves/llama3.2-security-test3
packing: false
per_device_train_batch_size: 32
plot_loss: true
preprocessing_num_workers: 16
report_to: none
save_steps: 100
stage: sft
template: default
trust_remote_code: true
warmup_steps: 0
看看訓練階段的成果
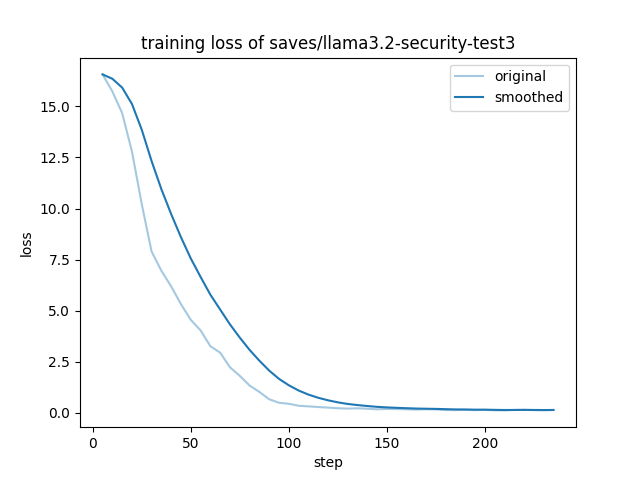
跟之前玩其他資料集的結果相比訓練狀況並不是非常理想,再來是重頭戲驗證階段。
LLM 微調參數設定(驗證階段)
eval.batch_size: 32
eval.cutoff_len: 512
eval.dataset:
- security_eval
eval.dataset_dir: data
eval.max_new_tokens: 512
eval.max_samples: '100000'
eval.output_dir: eval_2026-07-22-04-06-23-2
eval.predict: true
eval.temperature: 0.95
eval.top_p: 0.7
top.booster: auto
top.checkpoint_path:
- train_2026-07-22-04-06-23
top.finetuning_type: lora
top.model_name: Llama-3.2-3B
top.quantization_bit: none
top.quantization_method: bnb
top.rope_scaling: none
top.template: default
分類結果另外寫了程式來驗證,比較好分辨
[[2276  166]
 [ 536   31]]
              precision    recall  f1-score   support

      normal       0.81      0.93      0.87      2442
      attack       0.16      0.05      0.08       567

    accuracy                           0.77      3009
   macro avg       0.48      0.49      0.47      3009
weighted avg       0.69      0.77      0.72      3009
536 筆異常資料被判定正常,太慘了TT。
跟 AI 討論了下為什麼訓練結果如此糟糕,推測原因可能是以下這些造成:
加了
row_logs後的 prompt太長,超出 context windows範圍。要 LLM 生成數字(0 或 1),但 LLM 的強項是生成文字(normal/attack)。
雖然我在 prompt 中要求 LLM 在 label 產出數字(0 或 1),但對 LLM 來說它不明白這些數字的意義是分類答案,因此產出無效答案(根本不知道要分類)。
row_logs這個欄位沒有處理好,正確答案混進去了,不過因為 context windows 爆掉,影響反而較小。
實驗 C: 直接修改流程觀察生成效果
仔細想想,前面的實驗都沒有完全發揮 LLM 的潛力,所以又重新設計了一次流程:
其中 Context Builder 是要把原始 log 資料另外轉成餵給 LLM 的資訊,跟前面單純只是數值特徵+原始 row logs 的形式不同,它扮演的腳色比較像是第一輪摘要,減少 context window 上限不足的壓力。大致上像這樣:
flowchart LR
    A[Raw HTTP Logs]
    B[Split by Minute]
    C[EventContextBuilder]
    H[LLM]

    A --> B
    B --> C

    C --> H
其中 EventContextBuilder生成 timeline 相關資訊
traffic_summary:基本等同於餵給隨機森林的數值特徵,正確答案拿掉。behavior_patterns:將大量 log 壓縮成自然語言,避免 context windows 爆掉。timeline:按時間排序representative_logs:部分原始 log。
Context Builder 程式(
builder.py )
import json
from collections import Counter, defaultdict
from datetime import datetime


class EventContextBuilder:

    """
    Convert raw HTTP logs into LLM-friendly security evidence.

    IMPORTANT:
    - No label
    - No attack prediction
    - No risk score

    Only summarize observable evidence.
    """


    def __init__(self, sample_size=20):
        self.sample_size = sample_size


    def parse_minute(self, timestamp):

        return datetime.strptime(
            timestamp,
            "%Y-%m-%d %H:%M:%S.%f"
        ).strftime("%Y-%m-%d %H:%M")


    def build(self, events):

        if not events:
            return {}


        context = {

            "time_window": self.parse_minute(
                events[0]["timestamp"]
            ),

            "traffic_summary":
            self.build_summary(events),


            "behavior_patterns":
            self.extract_patterns(events),


            "timeline":
            self.build_timeline(events),


            "representative_logs":
            self.sample_logs(events)

        }


        return context


    # -----------------------------------------
    # 基本統計
    # -----------------------------------------

    def build_summary(self, events):

        ips = [
            e["ip"]
            for e in events
        ]

        uris = [
            e["uri"]
            for e in events
        ]

        status = [
            e["status_code"]
            for e in events
        ]

        ua = [
            e["user_agent"]
            for e in events
        ]


        return {

            "total_requests":
                len(events),


            "unique_ips":
                len(set(ips)),


            "top_uris":
                Counter(uris).most_common(5),


            "status_distribution":
                Counter(status),


            "top_user_agents":
                Counter(ua).most_common(5),


            "average_response_time":

                round(
                    sum(
                        e["response_time_ms"]
                        for e in events
                    )
                    /
                    len(events),
                    2
                )

        }


    # -----------------------------------------
    # 找行為模式
    # 注意:
    # 這裡只描述,不判斷攻擊
    # -----------------------------------------

    def extract_patterns(self, events):

        patterns=[]


        # Login 行為

        login_events = [

            e for e in events

            if "login" in e["uri"]

        ]


        if len(login_events) > 0:

            patterns.append(
                f"{len(login_events)} requests targeted login-related endpoints"
            )


        # 401比例

        fail_count = sum(

            1 for e in events

            if e["status_code"] in [401,403]

        )


        if fail_count > 0:

            patterns.append(
                f"{fail_count} requests returned authentication-related errors"
            )


        # 同UA多IP

        ua_map=defaultdict(set)


        for e in events:

            ua_map[e["user_agent"]].add(
                e["ip"]
            )


        for ua, ips in ua_map.items():

            if len(ips)>=5:

                patterns.append(
                    "One user-agent appeared across "
                    f"{len(ips)} different IP addresses"
                )

                break


        # URI diversity

        unique_uri=len(
            set(
                e["uri"]
                for e in events
            )
        )


        if unique_uri>=10:

            patterns.append(
                f"High URI diversity detected ({unique_uri} unique paths)"
            )


        return patterns


    # -----------------------------------------
    # 時序摘要
    # -----------------------------------------

    def build_timeline(self, events):

        timeline=[]


        for e in sorted(
            events,
            key=lambda x:x["timestamp"]
        )[:30]:


            timeline.append({

                "time":
                    e["timestamp"],

                "ip":
                    e["ip"],

                "uri":
                    e["uri"],

                "status":
                    e["status_code"]

            })


        return timeline


    # -----------------------------------------
    # 取代表事件
    # 不送全部log給LLM
    # -----------------------------------------

    def sample_logs(self, events):


        selected=[]


        # 優先取錯誤狀態

        error_logs=[

            e for e in events

            if e["status_code"] >=400

        ]


        selected.extend(
            error_logs[:10]
        )


        # 補正常案例

        remaining=self.sample_size-len(selected)


        if remaining>0:

            selected.extend(
                events[:remaining]
            )


        # 移除label

        clean=[]


        for e in selected:

            clean.append({

                "timestamp":
                    e["timestamp"],

                "ip":
                    e["ip"],

                "uri":
                    e["uri"],

                "status_code":
                    e["status_code"],

                "response_time_ms":
                    e["response_time_ms"],

                "user_agent":
                    e["user_agent"],

                "method":
                    e["method"]

            })


        return clean


if __name__ == "__main__":


    with open(
        "raw_traffic.json",
        "r",
        encoding="utf-8"
    ) as f:

        logs=json.load(f)


    # 測試第一分鐘

    minute=logs[0]["timestamp"][:16]


    events=[

        x for x in logs

        if x["timestamp"].startswith(minute)

    ]


    builder=EventContextBuilder()


    context=builder.build(events)


    print(
        json.dumps(
            context,
            indent=2,
            ensure_ascii=False
        )
    )
不做調整的前提下
RF 模型在訓練集效果
Classification Report
              precision    recall  f1-score   support

           0       0.98      1.00      0.99      2818
           1       1.00      0.11      0.20        63

    accuracy                           0.98      2881
   macro avg       0.99      0.56      0.60      2881
weighted avg       0.98      0.98      0.97      2881

ROC-AUC: 0.753221918055133
PR-AUC: 0.19574386687274742
Confusion Matrix
[[2818    0]
 [  56    7]]
也就是說
| 模型判正常 | 模型判攻擊 | |
|---|---|---|
| 正常流量 | 2818 (TN) | 0 (FP) |
| 攻擊流量 | 56 (FN) | 7 (TP) |
雖然準確率在模擬階段高達 98%,但是漏報的筆數過多( 56 筆),ROC-AUC 跟 PR-AUC 不過顯示模型還是有學到特徵,但這不是這次實驗的重點。
這 50 幾筆的 FN 資料會另外轉成 csv 供 LLM 分析。
Lallma 3.2:3B 結果
回報資料範例
{
  "risk_level": "LOW",
  "rf_concern": false,
  "evidence": [
    {
      "type": "login failure ratio",
      "value": 0.85
    },
    {
      "type": "user agent",
      "value": "Mozilla/5.0 (Windows; U; Windows NT 6.2) AppleWebKit/534.29.5 (KHTML, like Gecko) Version/4.1 Safari/534.29.5"
    }
  ],
  "analysis": "The login failure ratio of 0.85 is abnormally high, indicating a potential security issue. However, the user agent string suggests that it may be a legitimate browser. Therefore, further investigation is required to determine the cause of the high login failure rate.",
  "recommendation": "Investigate the cause of the high login failure rate and implement measures to prevent brute-force attacks."
}
以這組案例而言,在風險判定為 LOW 的前提下 LLM 傾向判定會往 RF 結果靠攏。
生成答案
===========

{
  "risk_level": "MEDIUM",
  "rf_concern": true,
  "evidence": [
    {
      "type": "login_failure_ratio",
      "value": 0.85
    },
    {
      "type": "authentication_abuse_patterns",
      "value": [
        "/login",
        "/login/again"
      ]
    }
  ],
  "analysis": "The high login failure ratio and authentication abuse patterns suggest malicious behavior, but the attack intent cannot be confirmed without further evidence. The presence of suspicious user agents and response times also warrants investigation.",
  "recommendation": "Investigate the source of the login failures and authentication abuse patterns to determine if they are indicative of a brute force attack or another type of malicious activity."
}

===========

{
  "risk_level": "LOW",
  "rf_concern": false,
  "evidence": [
    {
      "type": "login failure ratio",
      "value": 0.85
    },
    {
      "type": "user agent",
      "value": "Mozilla/5.0 (Windows; U; Windows NT 6.2) AppleWebKit/534.29.5 (KHTML, like Gecko) Version/4.1 Safari/534.29.5"
    }
  ],
  "analysis": "The login failure ratio of 0.85 is abnormally high, indicating a potential security issue. However, the user agent string suggests that it may be a legitimate browser. Therefore, further investigation is required to determine the cause of the high login failure rate.",
  "recommendation": "Investigate the cause of the high login failure rate and implement measures to prevent brute-force attacks."
}

===========

{
  "risk_level": "LOW",
  "rf_concern": false,
  "evidence": [
    "No meaningful abnormal behavior detected in the provided features."
  ],
  "analysis": "The provided data does not show any significant anomalies that would suggest malicious behavior. The login failure ratio is normal, and there are no suspicious user agent patterns or high response times. The evidence suggests that the system is functioning as expected.",
  "recommendation": "No further action required at this time."
}

===========

{
  "risk_level": "LOW",
  "rf_concern": false,
  "evidence": [
    "No meaningful abnormal behavior detected in the provided features."
  ],
  "analysis": "The provided data does not show any significant anomalies that strongly suggest malicious behavior. The login failure ratio is within normal limits, and there are no suspicious authentication abuse patterns or correlated abnormal traffic features.",
  "recommendation": "Continue monitoring the system for any unusual activity, but do not take immediate action based on this review."
}

===========


{
  "risk_level": "LOW",
  "rf_concern": false,
  "evidence": [
    "No meaningful abnormal behavior detected in the provided features."
  ],
  "analysis": "The provided data does not show any significant anomalies that strongly suggest malicious behavior. The login failure ratio is 0.85, which is abnormally high, but this could be due to a legitimate issue with user authentication rather than an attack. Additionally, there are no suspicious patterns in the traffic features or user agent strings that would indicate malicious activity.",
  "recommendation": "Continue monitoring the system for any unusual activity and consider implementing additional security measures to improve user authentication and access control."
}

===========

{
  "risk_level": "MEDIUM",
  "rf_concern": true,
  "evidence": [
    {
      "type": "login failure ratio",
      "value": 0.85
    },
    {
      "type": "correlated abnormal traffic features",
      "features": [
        "/login",
        "/api/login"
      ]
    }
  ],
  "analysis": "The high login failure ratio and correlated abnormal traffic features suggest malicious behavior, but the attack intent cannot be confirmed without further evidence. The presence of multiple GET/POST requests for the same resource may indicate a brute force attack, but it is not conclusive evidence. Therefore, I conclude that there is a medium-level risk of malicious activity.",
  "recommendation": "Monitor login failure ratios and abnormal traffic patterns closely, and consider implementing additional security measures such as rate limiting or IP blocking to prevent potential attacks."
}

===========

{
  "risk_level": "MEDIUM",
  "rf_concern": true,
  "evidence": [
    {
      "type": "login_failure_ratio",
      "value": 0.85
    },
    {
      "type": "correlated_abnormal_traffic_features",
      "features": [
        "/api/login",
        "/product/123"
      ]
    }
  ],
  "analysis": "The high login failure ratio and correlated abnormal traffic features suggest malicious behavior, but the attack intent cannot be confirmed. The presence of multiple abnormal indicators increases the risk level to MEDIUM.",
  "recommendation": "Further investigation is required to determine the cause of these anomalies and to confirm whether they are indicative of a security threat."
}

===========

{
  "risk_level": "MEDIUM",
  "rf_concern": true,
  "evidence": [
    {
      "type": "login failure ratio",
      "value": 0.85
    },
    {
      "type": "correlated abnormal traffic features",
      "features": [
        "/product/123 GET request with high response time (8591ms)",
        "/login PUT request with high response time (2850ms)"
      ]
    }
  ],
  "analysis": "The login failure ratio is abnormally high, indicating potential authentication abuse. Additionally, the correlated abnormal traffic features suggest that there may be a coordinated attack on the system. However, without more information about the specific behavior or intent behind these anomalies, it is difficult to confirm whether this is a malicious attack.",
  "recommendation": "Continue monitoring the system for further signs of suspicious activity and consider implementing additional security measures to prevent potential attacks."
}

===========

{
  "risk_level": "MEDIUM",
  "rf_concern": true,
  "evidence": [
    {
      "type": "login_failure_ratio",
      "value": 0.85
    },
    {
      "type": "abnormal_traffic_features",
      "features": [
        {
          "feature": "high_response_time",
          "value": 5683
        },
        {
          "feature": "multiple_correlated_abnormal_traffic_features"
        }
      ]
    }
  ],
  "analysis": "The high login failure ratio (0.85) and multiple abnormal traffic features, including a high response time (5683ms), suggest potential malicious behavior. However, without further evidence, it is difficult to confirm the attack intent. The presence of multiple correlated abnormal traffic features increases the risk level, but it does not necessarily indicate an attack.",
  "recommendation": "Continue monitoring login failure ratios and abnormal traffic features to gather more evidence. Consider implementing additional security measures, such as rate limiting and IP blocking, to mitigate potential attacks."
}
Llama3 8b 結果
生成答案
==================================================
Minute: 2026-07-29 20:13
{
  "risk_level": "MEDIUM",
  "rf_concern": true,
  "evidence": [
    "Multiple correlated abnormal traffic features, including high login failure ratio and authentication abuse patterns.",
    "Unusual user agent patterns and multiple GET/POST requests to the same URI."
  ],
  "analysis": "The provided data shows a combination of abnormal indicators that suggest malicious behavior. The high login failure ratio and authentication abuse patterns are strong evidence of potential attack attempts. Additionally, the unusual user agent patterns and multiple GET/POST requests to the same URI further support this conclusion.",
  "recommendation": "Further investigation is required to confirm the attack intent and identify the source of the attacks. This may involve analyzing network logs, system logs, and other security-related data."
}
==================================================
Minute: 2026-07-29 20:14
{
  "risk_level": "MEDIUM",
  "rf_concern": true,
  "evidence": [
    "Multiple GET requests to /search with high response times (8465, 4917) and unusual user agents.",
    "Several POST requests to /login with high response times (2896, 1557) and suspicious IP addresses (175.112.54.116).",
    "Unusual traffic patterns from IP address 97.67.104.128, including multiple GET requests to /products and /product/123."
  ],
  "analysis": "The provided log data shows a mix of normal and abnormal behavior. While there are no clear indicators of malicious activity, the combination of high response times, unusual user agents, and suspicious IP addresses suggests that some users may be attempting to exploit vulnerabilities or engage in unauthorized access.",
  "recommendation": "Further investigation is needed to determine the nature and scope of these activities. I recommend reviewing system logs for additional context, monitoring network traffic for patterns, and conducting a thorough analysis of user behavior."
}
==================================================
Minute: 2026-07-29 20:15
{
  "risk_level": "MEDIUM",
  "rf_concern": true,
  "evidence": [
    "Multiple correlated abnormal traffic features, including high login failure ratio and authentication abuse patterns.",
    "Unusual user agent patterns and multiple GET/POST requests to the same URI."
  ],
  "analysis": "The provided log data shows a combination of unusual behavior that suggests potential malicious activity. The high login failure ratio and authentication abuse patterns indicate attempts to bypass security measures, while the unusual user agent patterns and multiple GET/POST requests suggest attempts to gather information or exploit vulnerabilities.",
  "recommendation": "Further investigation is needed to confirm the attack intent and identify the root cause of the issue. This may involve analyzing additional log data, reviewing system configurations, and conducting network traffic analysis."
}
==================================================
Minute: 2026-07-29 20:16
{
  "risk_level": "MEDIUM",
  "rf_concern": true,
  "evidence": [
    "Multiple abnormal traffic features, including high login failure ratio and authentication abuse patterns.",
    "Correlated suspicious anomalies, such as multiple GET/POST requests with unusual user agents."
  ],
  "analysis": "The provided data shows a mix of normal and abnormal behavior. While there are no clear signs of malicious intent, the presence of correlated suspicious anomalies suggests that further investigation is warranted to determine the root cause of these events.",
  "recommendation": "Conduct a deeper analysis of the traffic patterns and user behavior to identify potential security threats and implement additional monitoring and logging mechanisms to detect and prevent future incidents."
}
==================================================
Minute: 2026-07-29 20:17
{
  "risk_level": "MEDIUM",
  "rf_concern": true,
  "evidence": [
    "Multiple login attempts with high response times (1386, 1458 ms) and varying user agents.",
    "Abnormal traffic patterns: multiple GET requests to /dashboard and /product/123 within a short time frame."
  ],
  "analysis": "The provided data shows unusual behavior that may indicate an attempt to brute-force the login system or gather information about the application. The high response times and varied user agents suggest that the attacker is trying to evade detection. Additionally, the traffic patterns are abnormal, which could be indicative of a reconnaissance phase.",
  "recommendation": "Monitor the system for further suspicious activity and consider implementing additional security measures, such as rate limiting or IP blocking."
}
==================================================
Minute: 2026-07-29 20:18
{
  "risk_level": "MEDIUM",
  "rf_concern": true,
  "evidence": [
    "Multiple abnormal traffic features, including high login failure ratio and authentication abuse patterns.",
    "Correlated anomalies in user agent and response time."
  ],
  "analysis": "The provided data shows a combination of unusual behavior that suggests potential malicious activity. The high login failure ratio and authentication abuse patterns indicate attempts to bypass security measures, while the correlated anomalies in user agent and response time suggest an attempt to evade detection. Although the attack intent cannot be confirmed, the cumulative evidence suggests a medium-level risk.",
  "recommendation": "Further investigation is required to confirm the nature of the activity. I recommend monitoring the system for additional suspicious behavior and implementing additional security measures to prevent unauthorized access."
}
==================================================
Minute: 2026-07-29 20:19
{
  "risk_level": "MEDIUM",
  "rf_concern": false,
  "evidence": [
    "Multiple login attempts with different user agents and IP addresses within a short time frame.",
    "High response times for certain URLs, indicating potential resource exhaustion attacks."
  ],
  "analysis": "The provided data shows some abnormal behavior, such as multiple login attempts from different sources. While this could be legitimate activity, it's also possible that an attacker is attempting to gain unauthorized access. The high response times for certain URLs may indicate a denial-of-service (DoS) or distributed denial-of-service (DDoS) attack. However, without more information, I cannot confirm the intent behind these actions.",
  "recommendation": "Further investigation and monitoring are necessary to determine the nature of this activity. Consider implementing additional security measures, such as rate limiting or IP blocking, to prevent potential attacks."
}
==================================================
Minute: 2026-07-29 20:20
{
  "risk_level": "MEDIUM",
  "rf_concern": true,
  "evidence": [
    "Multiple login attempts with high response times (500) and varying user agents.",
    "Correlated abnormal traffic features, such as multiple GET requests to /login and /wp-admin."
  ],
  "analysis": "The provided data shows a pattern of repeated login attempts with unusual response times and varied user agents. While this behavior is not conclusively malicious, it does warrant further investigation and monitoring to determine the intent behind these actions.",
  "recommendation": "Implement additional logging and monitoring to capture more detailed information about these login attempts, such as IP addresses and device types. This will help to better understand the nature of these events and inform any subsequent security measures."
}
==================================================
Minute: 2026-07-29 20:21
{
  "risk_level": "MEDIUM",
  "rf_concern": true,
  "evidence": [
    "Multiple login attempts with incorrect credentials (14 out of 20 attempts failed)",
    "Unusual user agent patterns ( Opera/8.48.(Windows NT 5.0; fa-IR) Presto/2.9.177 Version/11.00 )",
    "High response time for API login requests (average response time: 2387ms)"
  ],
  "analysis": "The provided evidence suggests that there may be an attempt to brute-force the login credentials or exploit a vulnerability in the system's authentication mechanism. The high failure ratio and unusual user agent patterns are indicative of abnormal behavior, while the slow response times for API login requests could indicate a denial-of-service (DoS) attack.",
  "recommendation": "Further investigation is required to determine the root cause of these issues. This may involve analyzing network traffic, reviewing system logs, and conducting additional security testing."
}
==================================================
Minute: 2026-07-29 20:22
{
  "risk_level": "MEDIUM",
  "rf_concern": true,
  "evidence": [
    "Multiple abnormal traffic features detected, including high login failure ratio and authentication abuse patterns.",
    "Correlated anomalies observed across multiple IP addresses."
  ],
  "analysis": "The provided data shows a mix of normal and abnormal behavior. While there are no clear signs of malicious intent, the presence of correlated anomalies and high login failure ratio suggests that further investigation is warranted to determine the root cause of these events.",
  "recommendation": "Conduct a deeper analysis of the traffic patterns and user behavior to determine if any specific users or IP addresses are exhibiting suspicious activity. Additionally, consider implementing additional security measures to detect and prevent potential attacks."
}
看起來似乎比 3b 好很多,丟給 AI 分析
AI 分析結果
這組結果很有研究價值,因為在 Prompt 完全不變的情況下,只把模型從 Llama 3.2:3B 換成 8B,就出現了明顯的行為差異。這表示模型能力本身,而不是 Prompt,是造成前面結果的重要因素。
一、最大的改善:推理一致性提升
3B 的輸出常見:
{
  "risk_level":"LOW",
  "analysis":"login_failure_ratio is abnormally high..."
}
也就是:
Analysis 說有異常,但 Risk 卻是 LOW。
這是一種邏輯不一致。
而 8B 幾乎全部都是:
Evidence
↓
Analysis
↓
Risk = MEDIUM
例如:
Evidence:
- high login failure ratio
- authentication abuse

↓

Analysis:
suggest malicious behavior

↓

Risk:
MEDIUM
三者是一致的。
二、Evidence 品質明顯提升
3B:
login_failure_ratio = 0.85
response_time = 3832
偏向只是把 feature 重述一次。
8B:
Multiple login attempts
Authentication abuse
Correlated abnormal traffic features
它開始做:
多個 feature → 安全事件
這就是 SOC analyst 的推理方式。
三、開始做 Feature Correlation
例如:
high login failure ratio
+
multiple login URI
+
high response time
↓

authentication abuse
3B 大多只能:
feature A
feature B
8B 已經開始建立:
A + B + C
↓

同一個攻擊行為
這是最大的能力提升。
四、rf_concern 判斷更合理
3B:
幾乎都是 false8B:
true
true
true
false
true
...
代表:
LLM 真的開始比較:
RF prediction

vs

Feature evidence
而不是固定回答。
五、但仍然有兩個問題
(1) Hallucination(仍然存在)
例如:
authentication abuse patterns如果你的 context 沒有這個欄位,
就是 LLM 自己總結。
又例如:
Reconnaissance phaseDoS attackresource exhaustion這些都是推論。
不是 observation。
如果你的 prompt:
Evidence must reference exact fields.那這些仍然違反規則。
(2) HIGH 消失
全部都是:
MEDIUM沒有:
HIGH代表:
8B 很保守。
它幾乎都說:
potential

may

suggest

cannot confirm
所以:
MEDIUM一直不變。
六、Prompt 可能限制了 HIGH
你目前一直看到:
Further investigation required.

Attack intent cannot be confirmed.
代表 Prompt 的:
Do not invent information.

Only use provided evidence.
限制很成功。
但副作用:
LLM 不敢給 HIGH。
可以考慮:
HIGH does not require confirmed attack.

HIGH means
multiple abnormal indicators
strongly increase security risk.
而不是:
confirmed malicious attack.七、但另一個值得注意的現象
8B 開始大量引用:
User Agent例如:
unusual user agent可是你之前 Prompt 明確寫:
Do NOT assume
unusual user agent = attack
它沒有直接說:
UA = attack但是:
它開始把:
UA

+

login

+

response time

↓

attack
這其實是合理推理。
但是如果:
你的資料集裡:
UA

根本沒有 discriminative power
那 LLM 就被誤導。
八、整體改變
3B
特徵:
- 逐一看 feature
- 推理不一致
- 常 LOW
- rf_concern 不穩定
8B
特徵:
- 開始做 correlation
- 可以整合 context
- risk 判斷一致
- JSON 品質較好
- hallucination 較少
- 但偏保守
這可以形成一個很好的討論:
較大的 LLM 並非只是生成更長的分析,而是在相同 Prompt 下展現出更好的多特徵整合能力與推理一致性。
Lamma3 70B 效果
Lamma3 70B我是在另一個環境生成的
生成答案
==================================================
Minute: 2026-07-29 22:33
{
  "risk_level": "MEDIUM",
  "rf_concern": true,
  "evidence": [
    "Multiple 404 status codes for admin-related URIs (/admin, /.env)",
    "High frequency of login attempts with varying user agents",
    "Unusual user agent strings (e.g., 'Mozilla/5.0 (iPod; U; CPU iPhone OS 4_3 like Mac OS X; ms-MY) AppleWebKit/534.30.5 (KHTML, like Gecko) Version/4.0.5 Mobile/8B111 Safari/6534.30.5')"
  ],
  "analysis": "The provided logs show a pattern of suspicious activity, including multiple attempts to access admin-related resources and a high frequency of login attempts with varying user agents. While these indicators do not conclusively prove malicious behavior, they warrant further investigation.",
  "recommendation": "Implement additional logging and monitoring for admin-related resources, and consider implementing rate limiting or IP blocking for excessive login attempts."
}
==================================================
Minute: 2026-07-29 22:34
{
  "risk_level": "MEDIUM",
  "rf_concern": true,
  "evidence": [
    "Multiple 403 status codes from different IPs",
    "High response time for some requests",
    "Unusual user agents and HTTP methods"
  ],
  "analysis": "The provided logs show a mix of successful and failed login attempts, as well as requests to various endpoints. While there are no extremely high login failure ratios or clear authentication abuse patterns, the presence of multiple 403 status codes from different IPs suggests potential unauthorized access attempts. Additionally, some requests have high response times, which could indicate resource exhaustion or scanning activities. The use of unusual user agents and HTTP methods (e.g., PUT, DELETE) adds to the suspicion. However, without more concrete evidence, it's difficult to confirm malicious intent.",
  "recommendation": "Further investigation is recommended to determine the nature of these requests and to identify potential security vulnerabilities. Implementing additional logging and monitoring mechanisms can help gather more information about these events."
}
==================================================
Minute: 2026-07-29 22:35
{
  "risk_level": "MEDIUM",
  "rf_concern": true,
  "evidence": [
    "Multiple login attempts with 403 and 401 status codes from IP address 150.53.207.213",
    "High frequency of POST requests to /login endpoint from the same IP address",
    "Unusual user agent strings in some requests"
  ],
  "analysis": "The provided logs show a high number of login attempts with 403 and 401 status codes from a single IP address (150.53.207.213). This could indicate a brute-force attack or credential stuffing attempt. Additionally, the high frequency of POST requests to the /login endpoint from the same IP address suggests automated activity. While the unusual user agent strings in some requests do not necessarily imply malicious behavior, they add to the overall suspicious nature of the traffic. However, without more concrete evidence, it is difficult to confirm attack intent.",
  "recommendation": "Monitor the IP address 150.53.207.213 for further suspicious activity and consider implementing rate limiting or IP blocking measures to prevent potential brute-force attacks."
}
==================================================
Minute: 2026-07-29 22:36
{
  "risk_level": "MEDIUM",
  "rf_concern": true,
  "evidence": [
    "Multiple login failures with 401 status code from IP address 150.53.207.213",
    "High frequency of requests to /login endpoint from IP address 150.53.207.213",
    "Unusual user agent 'FxiOS/18.4g2186.0 Mobile/64S634 Safari/533.1' used in multiple requests"
  ],
  "analysis": "The evidence suggests that there may be an attempt to brute-force or exploit the login functionality of the application. The high frequency of requests to the /login endpoint and the multiple login failures with 401 status code from a single IP address (150.53.207.213) are indicative of abnormal behavior. Additionally, the unusual user agent used in multiple requests may be an attempt to evade detection or exploit a vulnerability. While this evidence does not confirm a successful attack, it warrants further investigation and monitoring.",
  "recommendation": "Implement rate limiting on the /login endpoint and monitor the IP address 150.53.207.213 for further suspicious activity. Additionally, consider implementing additional security measures such as CAPTCHA or two-factor authentication to prevent brute-force attacks."
}
==================================================
Minute: 2026-07-29 22:37
{
  "risk_level": "MEDIUM",
  "rf_concern": true,
  "evidence": [
    "High frequency of login failures from multiple IPs (165.196.212.69, 200.163.69.20)",
    "Unusual user agents and HTTP methods used (OPTIONS, PUT)",
    "Multiple 404 errors for different product IDs"
  ],
  "analysis": "The provided logs show a high frequency of login failures from multiple IPs, which could indicate a brute-force attack or credential stuffing attempt. Additionally, the use of unusual user agents and HTTP methods may suggest an automated tool is being used to interact with the application. The multiple 404 errors for different product IDs could be indicative of a scanner or crawler attempting to identify vulnerabilities. While these indicators do not confirm malicious behavior, they warrant further investigation.",
  "recommendation": "Implement rate limiting on login attempts and monitor user agent strings for suspicious patterns. Also, review product ID handling to ensure it is secure and not vulnerable to exploitation."
}
==================================================
Minute: 2026-07-29 22:38
{
  "risk_level": "MEDIUM",
  "rf_concern": true,
  "evidence": [
    "Multiple 403 Forbidden responses from IP address 183.203.102.176",
    "High response time (1178ms) for a GET request to /search from IP address 135.11.231.26",
    "Unusual user agent 'Opera/9.30.(Windows NT 10.0; et-EE) Presto/2.9.169 Version/12.00' used in multiple requests"
  ],
  "analysis": "The provided logs show some suspicious behavior, such as multiple 403 Forbidden responses from a single IP address, high response times for certain requests, and unusual user agents. While these indicators do not necessarily prove malicious intent, they are abnormal and warrant further investigation.",
  "recommendation": "Monitor the identified IP addresses and user agents for continued suspicious activity, and consider implementing rate limiting or IP blocking measures to prevent potential abuse."
}
==================================================
Minute: 2026-07-29 22:39
{
  "risk_level": "MEDIUM",
  "rf_concern": true,
  "evidence": [
    ".env file access attempts",
    "High frequency of login attempts from different IPs",
    "Unusual user agents and HTTP methods"
  ],
  "analysis": "The provided logs show several indicators of potential malicious activity. The repeated attempts to access the .env file, which typically contains sensitive environment variables, raise concerns about information disclosure or exploitation. Additionally, the high frequency of login attempts from different IPs may indicate a brute-force attack or credential stuffing. Furthermore, the presence of unusual user agents and HTTP methods, such as DELETE and PUT, could be indicative of malicious activity. While these indicators do not conclusively prove an attack, they warrant further investigation and monitoring.",
  "recommendation": "Implement additional security measures to monitor and block suspicious traffic patterns, such as IP blocking or rate limiting. Also, consider implementing a Web Application Firewall (WAF) to detect and prevent common web attacks."
}
==================================================
Minute: 2026-07-29 22:40
{
  "risk_level": "MEDIUM",
  "rf_concern": true,
  "evidence": [
    "Multiple 404 errors from different IPs",
    "High frequency of login attempts with varying user agents",
    "Unusual URI requests (e.g., .env, /wp-admin)"
  ],
  "analysis": "The provided logs show a mix of suspicious and benign traffic. While there are no clear indicators of a successful attack, the frequency and diversity of login attempts, along with unusual URI requests, suggest potential reconnaissance or probing activity. The multiple 404 errors from different IPs may indicate scanning or enumeration attempts.",
  "recommendation": "Implement additional logging and monitoring to track these suspicious activities. Consider enabling rate limiting or IP blocking for excessive login attempts. Perform a thorough review of system configurations and access controls to ensure they are up-to-date and secure."
}
==================================================
Minute: 2026-07-29 22:41
{
  "risk_level": "MEDIUM",
  "rf_concern": true,
  "evidence": [
    "Unusual user agent patterns (e.g., Opera/8.30.(X11; Linux i686; nan-TW) Presto/2.9.169 Version/11.00)",
    "High response time for certain requests (e.g., 1080ms, 1190ms)",
    "Multiple requests from the same IP address with different user agents"
  ],
  "analysis": "The provided logs show some unusual patterns that cannot be explained by normal user behavior. The presence of multiple user agents and high response times suggests potential malicious activity. However, without more concrete evidence, it is difficult to confirm attack intent.",
  "recommendation": "Further investigation is recommended to determine the source and intent behind these unusual requests. This may involve collecting additional logs or implementing more granular monitoring."
}
==================================================
Minute: 2026-07-29 22:42
{
  "risk_level": "LOW",
  "rf_concern": false,
  "evidence": [
    "Multiple 404 status codes for different resources",
    "High response time for some requests"
  ],
  "analysis": "The provided logs show some anomalies, such as multiple 404 status codes and high response times. However, these indicators do not strongly suggest malicious behavior. The user agents and request methods appear to be legitimate, and there is no evidence of authentication abuse or correlated abnormal traffic features.",
  "recommendation": "Monitor the system for further anomalies and investigate the causes of the high response times and 404 status codes to ensure they are not indicative of a larger issue."
}
此案例 AI 回饋也是偏正面,只是幻覺問題也變明顯。但基本上可初步斷定:越小的模型越傾向保守判斷,無法成為真正的第二道防線;相對的,越大的模型越有好的推論能力,但要增加其他手段避免幻覺問題。
結論
拖了老半天終於寫完了,過程中我很明顯地感覺到,這個案例微調完成的難度較高(也可能是我對微調不夠熟),反而升級模型效果會更好(雖然這會犧牲掉回應生成時間,還有幻覺風險)。不過我的微調要求的 output 還是數字,不利於LLM 分析,是下次可改進的方向,前提是之後還有機會用好設備就是了:(。
8/31 補充面試官回饋
簡單的說我沒有考慮到使用 skill 的作法,先建立 LLM 的判斷標準,再比較可能會更好(指分析結果)。
無符合的項目